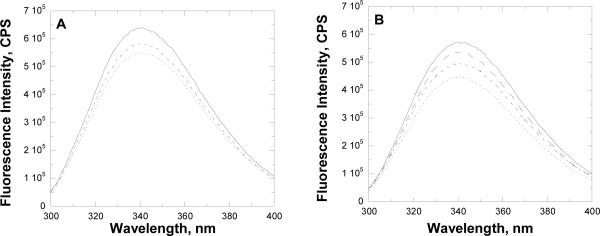
Figure 5.
Fluorescence studies with CSA as inhibitor. Panel A, fluorescence titration of WT MshC with 0 (solid line), 91 (broken line), and 410 (dotted line) nM CSA; Panel B, fluorescence spectra of WT (solid line), W227F (big broken line), D251N (small broken line) and H55A (dotted line) forms of free MshC. In all experiments, the concentration of enzyme utilized is 0.1 μM.

