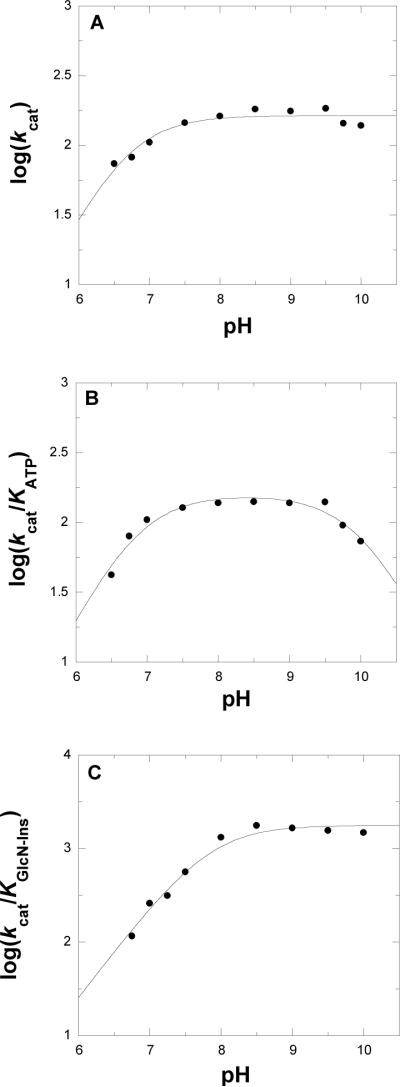
Figure 2.
pH Dependence of the kcat (panel A), kcat/Km for ATP (panel B) and kcat/Km for GlcN-Ins (panel C). MshC activity was assayed at saturating concentrations GlcN-Ins and cysteine, and varying concentrations of ATP at 25 °C as described in the Experimental Procedures section. The lines are fits of the data to eqs 3 and 4.

