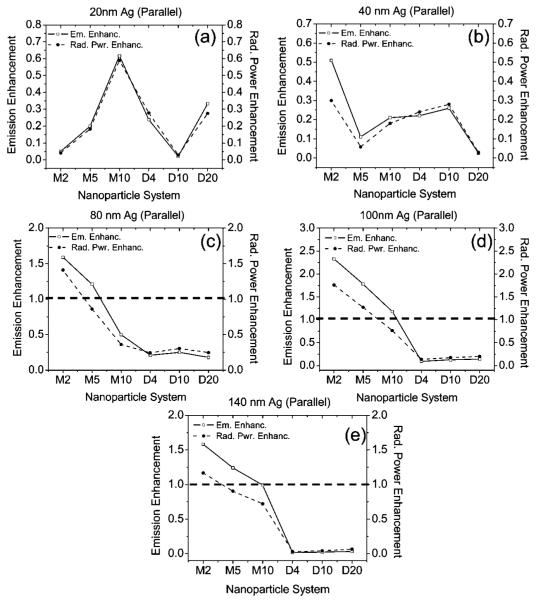
Figure 5.
Computed fluorescence emission enhancement/quenching along the x-y plane and total radiated power enhancement/quenching (integrated around a closed surface containing the system) of the following: (a) 20-nm Ag nanoparticles; (b) 40-nm Ag nanoparticles; (c) 80-nm Ag nanoparticles; (d) 100-nm Ag nanoparticles; (e) 140-nm Ag nanoparticles with the parallel fluorophore orientation (along y-axis). The x-axis of every figure denotes the nanoparticle system where M denotes a single particle or monomer and D denotes a dimer. The number after the M represents the spacing of the fluorophore from the surface of the monomer (in nm), and the number after D denotes the surface-surface distance between the dimer particles (in nm). The fluorophore is located midway between the dimer particles. The dashed line along 1.0 represent the boundary between fluorescence enhancement and quenching.

