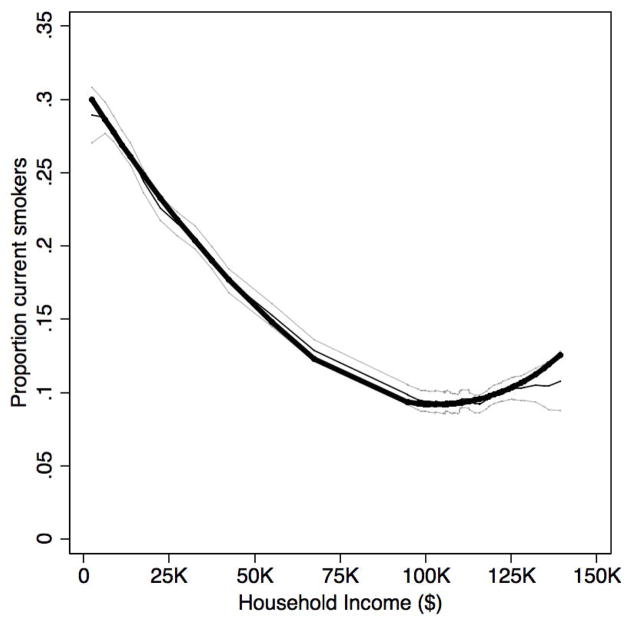
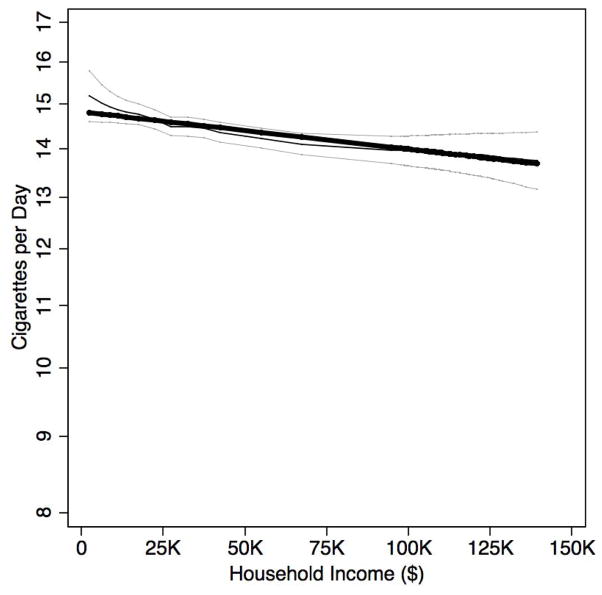
Figure 3.
Nonlinear regression models (thick black lines) of the effect of household income (dollars) on current smoking (A), and ln(cigarettes/day) (B) from equations S1a–S1b overlaid on the parallel nonparametric models (thin black lines) with pointwise 95% confidence intervals (thin grey lines) from equations 1a–1b. A linear specification with a quadratic change in effect models current smoker status at $70K (SE 7.1K) to model the nonparametric relationship in Panel A. A linear specification models the effect of household income on ln(cigarettes/day) as shown in Panel B.


