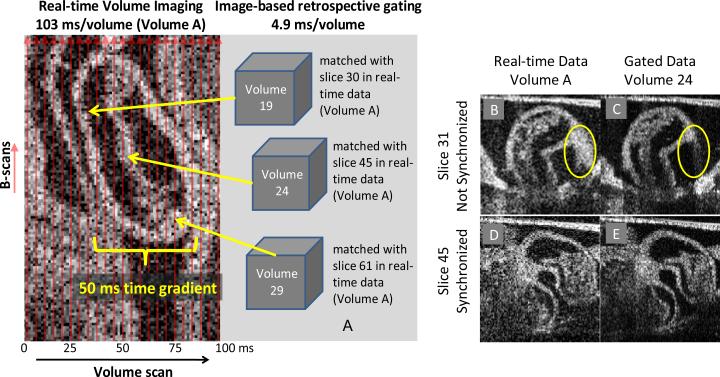
Fig. 2.
(A) Schematic showing proposed validation scheme. The real-time volume is captured in 103 ms, while image-based retrospective gating data represents a 4.9 ms time interval. The left part of Fig. 2(a) shows an en face real-time OCT image with the B-scan direction superimposed on the image. The right part of Fig. 2(a) shows various volumes with yellow arrows pointing to the B-scan that represents the identical phase in the cardiac cycle. (B, C) slice 31 from a real-time volume (volume scan A) and an image-based retrospective gated volume (volume 24). (D, E) slice 45 from a real-time volume (volume scan A) and an image-based retrospective gated volume (volume 24). In slice 31 the real-time volume and gated volume are not synchronized. The images are taken at different phases in the cardiac cycle as clearly seen within the yellow oval. Slice 45 in volume 24 is synchronized with slice 45 in the real-time volume as can be seen by the similarity in the 2 images.

