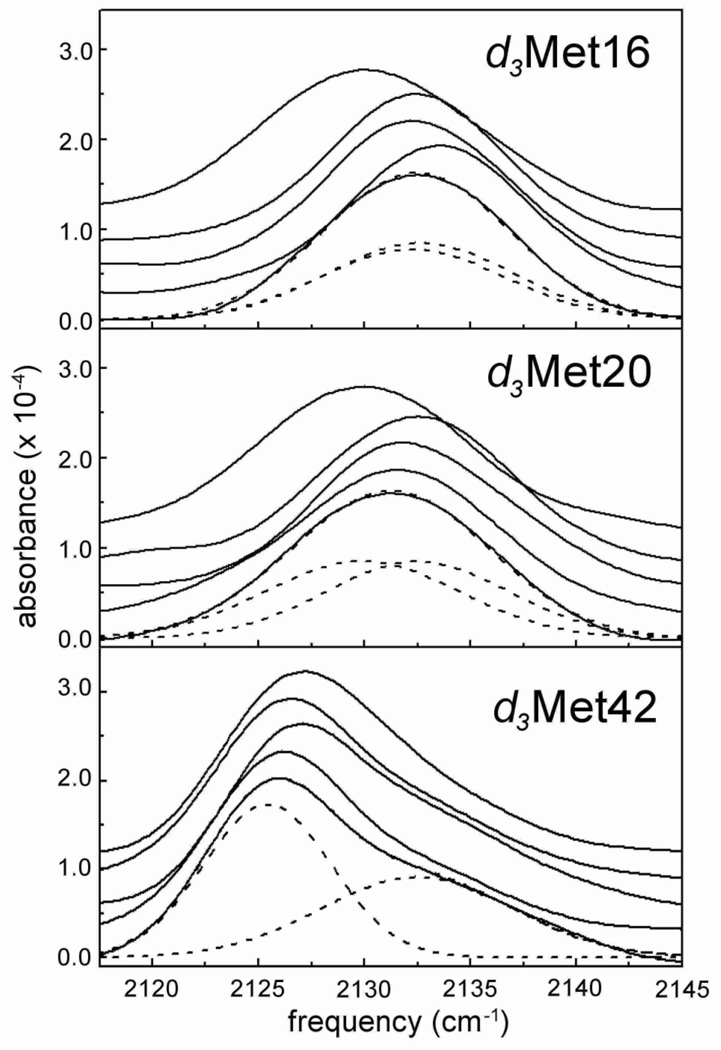
Figure 3.
Spectra of deuterated proteins. Shown from top to bottom of each panel are the spectra for the apoenzyme, the NADPH complex, the folate/NADP+ complex, the MTX/NADPH complex, and the folate complex. For the folate complex, the components and total fit of absorption band are shown with dashed lines. Fits of all other spectra are included in Supporting Information.

