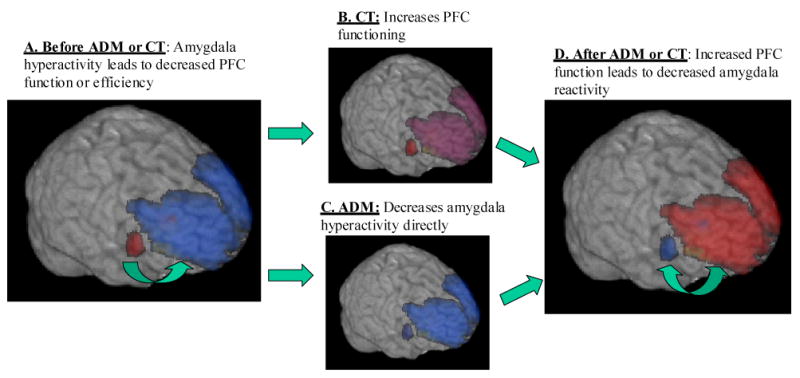
Figure 4. Hypothetical time-course of changes to amygdala and prefrontal function associated with ADM and CT.

A. During acute depression, amygdala activity is increased (red) and prefrontal activity is decreased (blue) compared to healthy individuals; B. CT effectively exercises the PFC, yielding increased inhibitory function; C. ADM targets amygdala function more directly, decreasing its activity; D. After ADM or CT, amygdala function is decreased and prefrontal function is increased. The double-headed arrow between the amygdala and PFC represents the bidirectional homeostatic influences which are believed to operate in healthy individuals.
