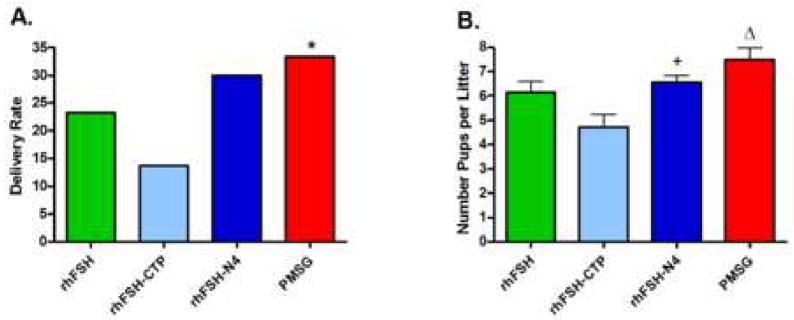
Figure 3.
Pregnancy studies. A. Bar graph of delivery rates in female mice treated with either rhFSH, rhFSH-CTP, rhFSH-N4 and PMSG. *p<0.05 compared to PMSG. B. Graph of Litter size following treatment with rhFSH, rhFSH-CTP, rhFSH-N4 and PMSG. +p<0.05 compared to rhFSH-CTP; Δp<0.001 compared to rhFSH-CTP. Error bars represent ± SEM

