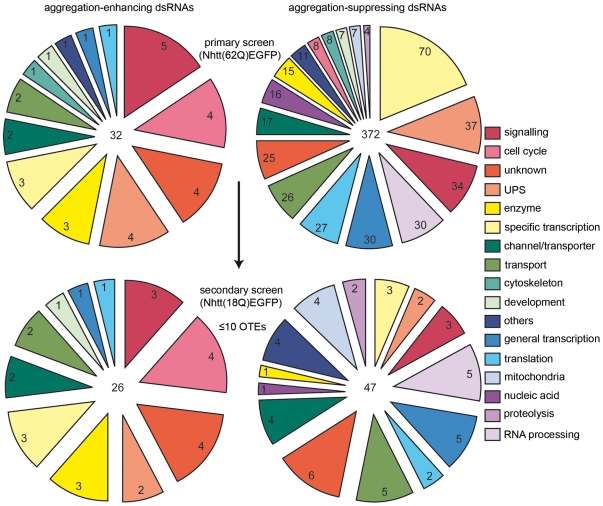
Figure 2. Functional categorization of primary screen candidates.
404 candidates identified through primary RNAi screening were placed into functional groups based on Gene Ontology terms for Biological Process and Molecular Function retrieved from FlyBase and FLIGHT databases. Aggregation-enhancing dsRNAs (left charts) and aggregation-suppressing dsRNAs (right charts) are represented by largely distinct functional groups (top charts). Functional group representations following secondary screening in Nhtt(18Q)EGFP cells, where candidates were pruned to eliminate dsRNAs which non-specifically reduced the expression of Nhtt(18Q)EGFP and those with greater than 10 predicted 19 nt OTEs and shown in the lower charts. Numbers at the centre of each pie chart indicate the total number of candidates and peripheral numbers indicate the number of candidates represented by that category. OTE pruning and elimination of candidates following secondary screening largely reduced the number of aggregate-suppressing dsRNAs, particularly those represented by the specific transcription functional group.

