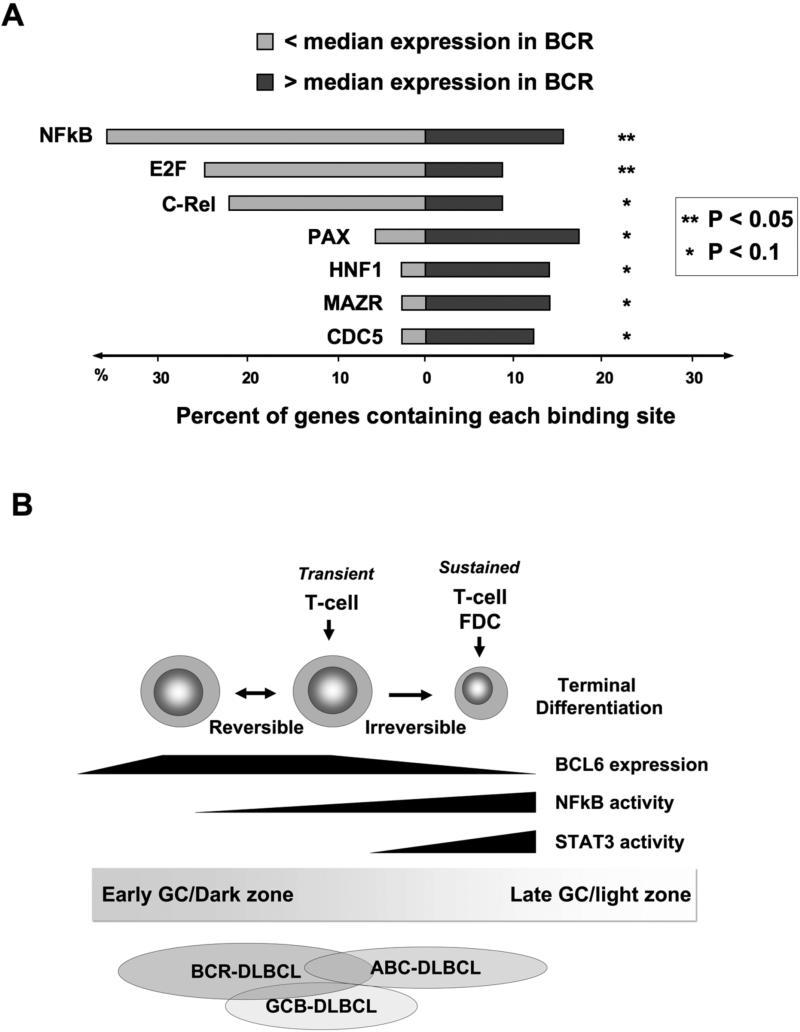
Figure 3. The balance of power between BCL6, NFkB and STAT3.
A: A transcription factor binding site analysis (TRANSFAC) was performed within DNA sequences corresponding to the binding peak of BCL6 within target genes identified by ChIP-on-chip[27]. Light grey bars represent the percent of genes that are differentially expressed below the median in BCL6-dependent BCR-type (B-cell receptor signature) DLBCLs while the percent of genes above the median are represented in dark grey. The P value represents the significance of differential representation of genes above or below the median for each of the indicated transcription factor binding sites. B: BCL6 expression is upregulated when B-cells enter the germinal center reaction. In dark zone centroblasts BCL6 can block NFkB signaling through several mechanisms and directly repress STAT3 as described in the text. Transient interactions with T-cells can induce B-cell NFkB activity in a reversible fashion, which may allow B-cells to recycle back to the dark zone. Conversely, the actions of cytokines and/or more prolonged contact with FDCs or T-cells can tip the balance towards NFkB and STAT3 and downregulated BCL6 expression. GCB DLBCLs are generally proposed to reflect the biology of cells earlier in the germinal center reaction, while ABC DLBCLs are generally believed to represent later and/or exiting cells. The BCR/BCL6 dependent type of DLBCLs may partially overlap with both of these categories, but their BCL6 dependent biology suggests that they have features that overlap with GC B-cells in which BCL6 is functionally active.

