
Figure 2.
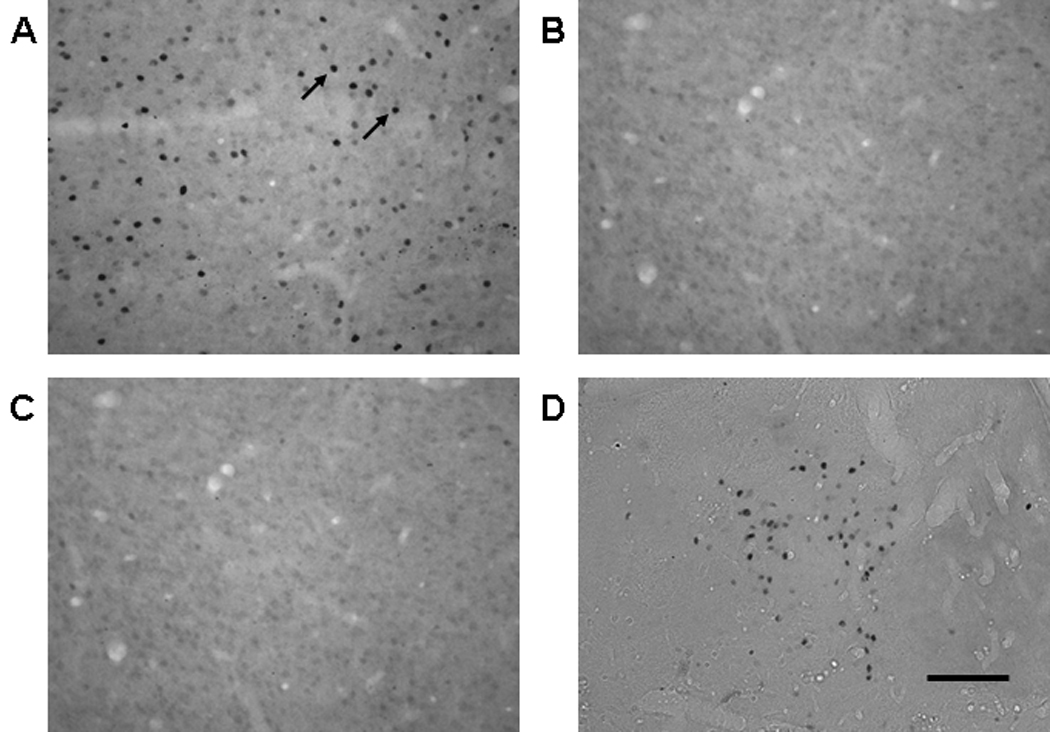
Representative photomicrographs of Fos protein expression in the IL from a rat in (A) the COC-NoA group, (B) the Sal-NoA group and (C) the COC-Chloralose group in Experiment 1. Also pictured (D) is a representative photomicrograph taken from the mediodorsal thalamus of a rat in the COC-Chloralose group. Visible Fos protein expression was manifested as dark ovals (highlighted by arrows). All images were taken at 20× magnification. Scale bar is equal to 100 µm.