
Figure 3.
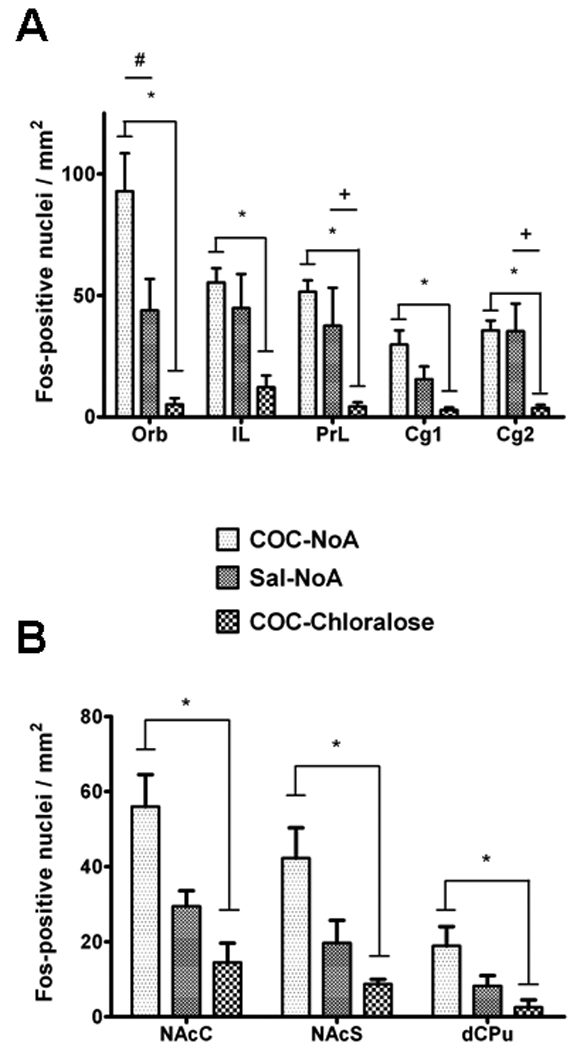
Number of Fos-positive nuclei/mm2 in cortical (A) and striatal (B) regions of rats in Experiment 1. Rats received either cocaine while nonanesthetized (COC-NoA group), saline while nonanesthetized (Sal-NoA group) and cocaine while under α-chloralose anesthesia (COC-Chloralose group). A * represents significantly greater Fos expression in the CoC-NoA group than the COC-Chloralose group (p < 0.05). A + represents significantly greater Fos expression in the Sal-NoA group versus the COC-Chloralose group (p < 0.05). A # represents significantly greater Fos expression in the COC-NoA group versus the Sal-NoA group (p < 0.05).