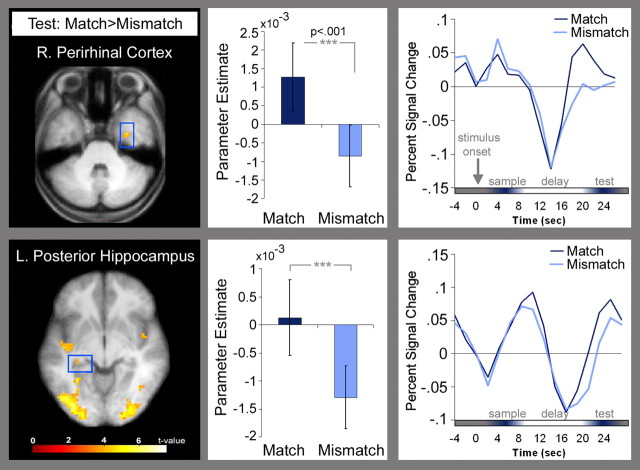
Figure 4.
Right perirhinal (MNI coordinates: x = 33, y = −6, z = −33; max t = 4.75) and left hippocampal (MNI coordinates: x = −30, y = −33, z = −6; max t = 3.96) regions where BOLD signal was higher for correctly identified match than mismatch displays. Parameter estimates and trial-averaged time courses associated with correctly identified match (dark blue) and mismatch (light blue) test displays are shown.

