
Figure 5.
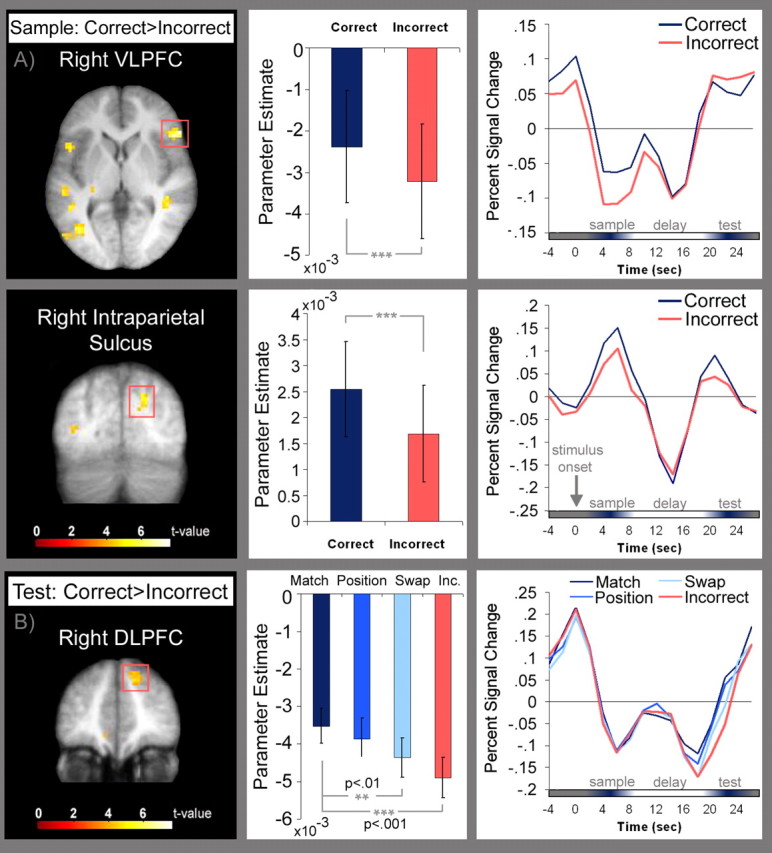
Plots of prefrontal and parietal activation associated with short-term memory accuracy. A, Regions in right ventrolateral prefrontal cortex [Brodmann area (BA) 45/47; MNI coordinates: x = 51, y = 24, z = 6; max t = 6.41], and inferior intraparietal sulcus (MNI coordinates: x = 21, y = −78, z = 33; max t = 4.84) where activation during the sample period was greater for correct than for incorrect trials. Plots of parameter estimates for correct (blue) and incorrect (pink) trials are shown for each brain region along with trial-averaged time courses. B, A region in right dorsolateral prefrontal cortex (BA 9; MNI coordinates: x = 18, y = 42, z = 39; max t = 4.96) where test period activation was increased on correct, relative to incorrect trials. Plots of parameter estimates and trial-averaged time courses associated with correctly identified test displays (match, mismatch position, and mismatch swap, respectively) and with test displays that elicited incorrect responses are shown.