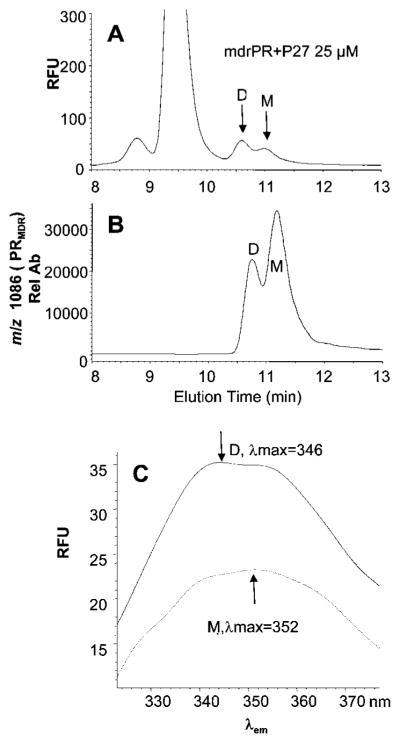
Figure 5. Size-exclusion chromatography of PRMDR treated with P27 and the corresponding fluorescent spectra for the dimeric and monomeric forms.
PRMDR (1 μM final concentration) was incubated for 16 h at 37 °C in 150 mM ammonium acetate buffer containing 100 μg · ml−1 BSA with P27 at 25 μM. Following incubation, 8 μl of the PR was sampled and analysed by size-exclusion chromatography. (A) PRMDR was detected by fluorescence by excitation at 280 nm and emission at 350 nm and (B) by MS in SIM mode for the PRMDR-specific ion (m/z 1086, 10+). (C) The fluorescent emission spectra λem from 325–375 nm were obtained at the peak apex for each peak using reference spectra at 10.2 and 12 min. The spectra for the dimer (D) (solid line, λmax = 346 nm) and the monomer (M) (dashed line, λmax = 352 nm) are shown. Rel Ab, relative ion abundance; RFU, relative fluorescence units.

