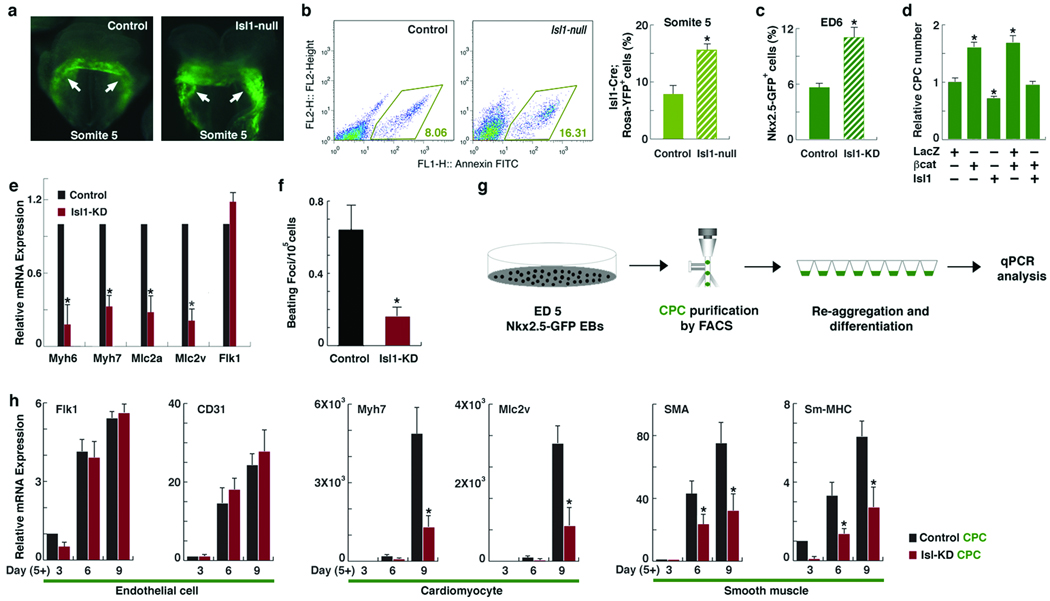
Figure 3.

Isl1 loss-of-function results in expansion of CPCs and suppression of their myocardial and smooth muscle lineages.a, YFP expression in control (RosaYFP, Isl1Cre/+, left) and Isl1-null (RosaYFP, Isl1Cre/Cre, right) embryos at the 5-somite stage. Arrows indicate YFP+ CPCs. Scale bars, 50 µm. b, Quantification of YFP+ cells in indicated embryos at somite 5 (mean ± s. d.; n=3; *P < 0.01). c, Quantification of GFP+ cells in ED6 Nkx2.5-GFP EBs with or without Isl1 KD (mean ± s. d.; n=3; *P < 0.01). d, Relative number of cells on the 2nd day after transfecting EB-derived CPCs with lacZ, β-catenin, or Isl1 (mean ± s. d.; n=6; *P < 0.01). e, Relative mRNA expression of indicated genes in control or Isl1-KD EBs at ED 9, determined by qPCR (mean ± s. d.; n=4; *P < 0.01). f, Number of beating foci per 105 cells in control or Isl1-KD EBs at ED12. g, Schematic diagram of isolating CPCs from ES cells and their differentiation. h, Relative mRNA expression of endothelial (Flk1, CD31), cardiomyocyte (Myh7, Mlc2v) or smooth muscle (Sma, Sm-mhc) genes during CPC differentiation, determined by qPCR (mean ± s. e. m. ; n=4; *P < 0.05).
