Fig. 2.

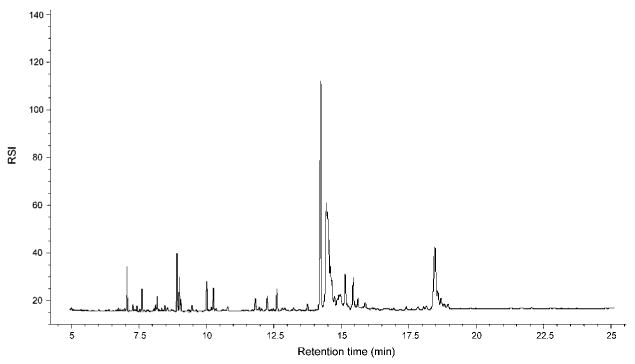
Typical gas chromatogram obtained after separation of total cellular fatty acids isolated from H. capsulatum cells. The conditions for fatty acid analysis were as described in Methods. RSI, relative signal intensity.

Typical gas chromatogram obtained after separation of total cellular fatty acids isolated from H. capsulatum cells. The conditions for fatty acid analysis were as described in Methods. RSI, relative signal intensity.