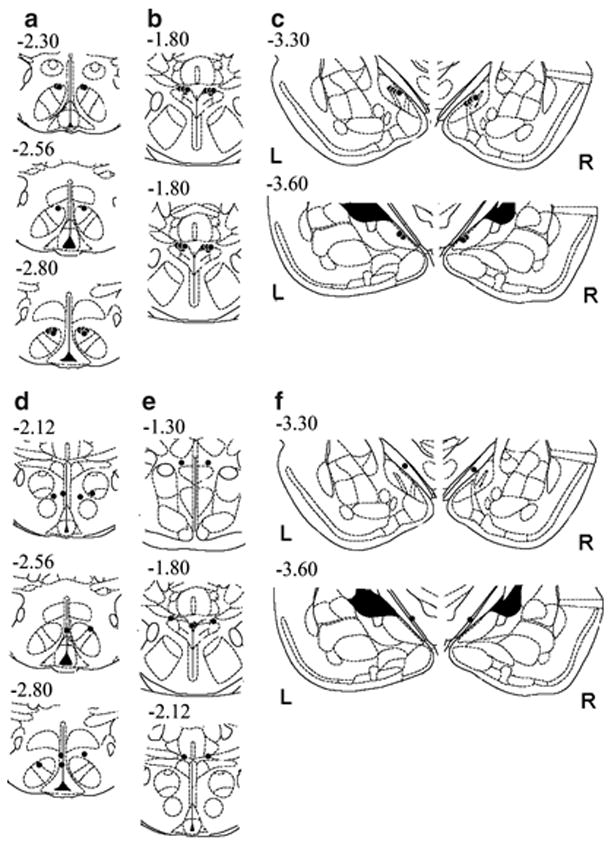
Figure 3.

Illustration of reconstructed injection sites from Experiment 5. Correct bilateral injection placements (‘hits’) are indicated as closed circles in the ventromedial (VMN; n = 7), paraventricular nuclei of the hypothalamus (PVN; n = 8), and medial amygdala (MeA; n = 6) (panels a, b and c, respectively). Incorrect injection placements (‘misses’) are indicated in panels (d), (e) and (f) for the VMN (n = 5), PVN (n = 4), and MeA (n = 2), respectively. Brain structure diagrams of coronal sections are adapted from Paxinos and Watson (Paxinos and Watson, 1998), the numbers refer to anterior–posterior distance from bregma in mm, L: left, R: right side of the brain.
