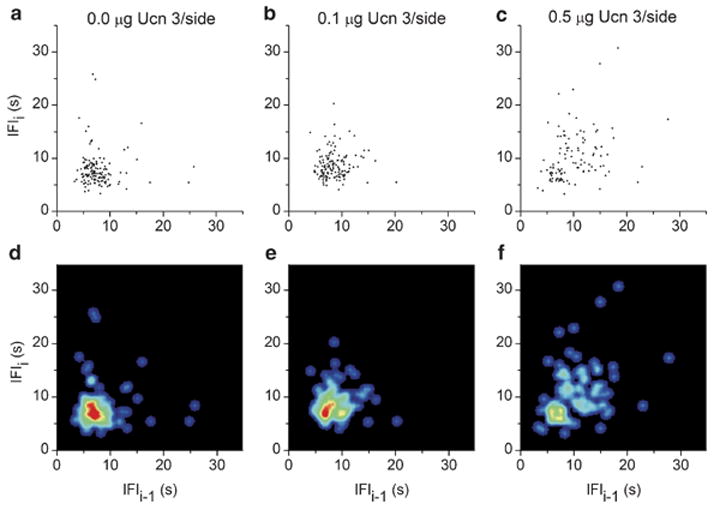
Figure 7.

Illustration of the serial regularity within feeding bouts after bilateral injection of murine Ucn 3 into the paraventricular nucleus of the hypothalamus. Panels reflect doses of 0.0 (a, d), 0.1 (b, e), or 0.5 μg murine Ucn 3/side (c, f). Return maps (panels a–c) are constructed from ‘within-bout’ inter-feeding intervals (IFIs) from one representative rat (# PVN-1) during the first 4 post-injection hours. Under vehicle treatment, rats showed serial regularity from pellet to pellet reflected in a ‘clustered’ return map. Ucn 3 increased the dispersion/irregularity of successive feeding events, reflected as an increased spread and quantified as an increased return map entropy. Panels (d), (e), and (f) show density plots of the IFI return maps (joint IFI probability distribution) in a color-coded form from the representative rat (# PVN-1). The spreading and decreased ‘peakedness’ of the pattern indicates the irregularity of feeding within bouts that resulted from Ucn 3 treatment. Warmer colors (toward red) indicate higher local probabilities.
