
FIGURE 4.
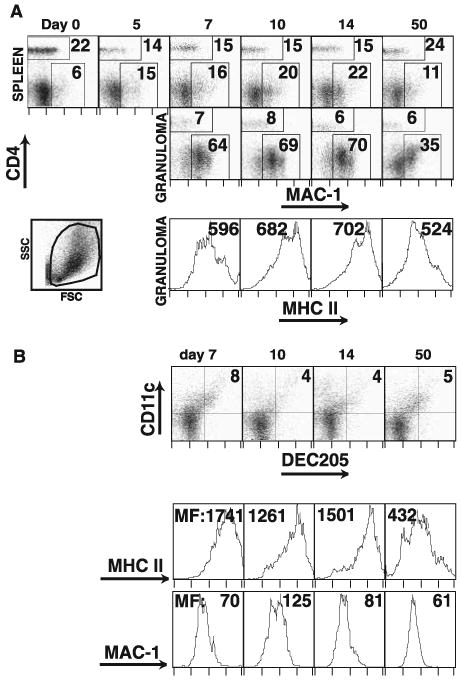
Macrophage and dendritic cells in liver granulomas. Flow cytometric analysis of splenocyte and granuloma-infiltrating cells during the course of Histoplasma infection. A, Dot plots represent expression of Mac-1 and CD4 surface staining on open gated cells from spleen (top row) and granuloma cells (middle row). Lower left dot plot demonstrates forward and orthogonal scatter of the open gate for a granuloma suspension. Values on dot plots represent the percentage of the gated cells in the indicated regions. Histograms represent MHC class II expression on Mac-1 + granuloma cells, and values are mean fluorescent intensity (MFI) (bottom row). B, Dot plots represent expression of DEC205 and CD11c surface staining on open gated cells from granuloma (top row). Indicated values are the quadrant percent of the gated cells. Histograms represent MHC class II expression (middle row) and Mac-1 expression (bottom row) on DEC205+CD11c+ cells. Values are MFI for the gated population. All plots and histograms are representative of three independent experiments.