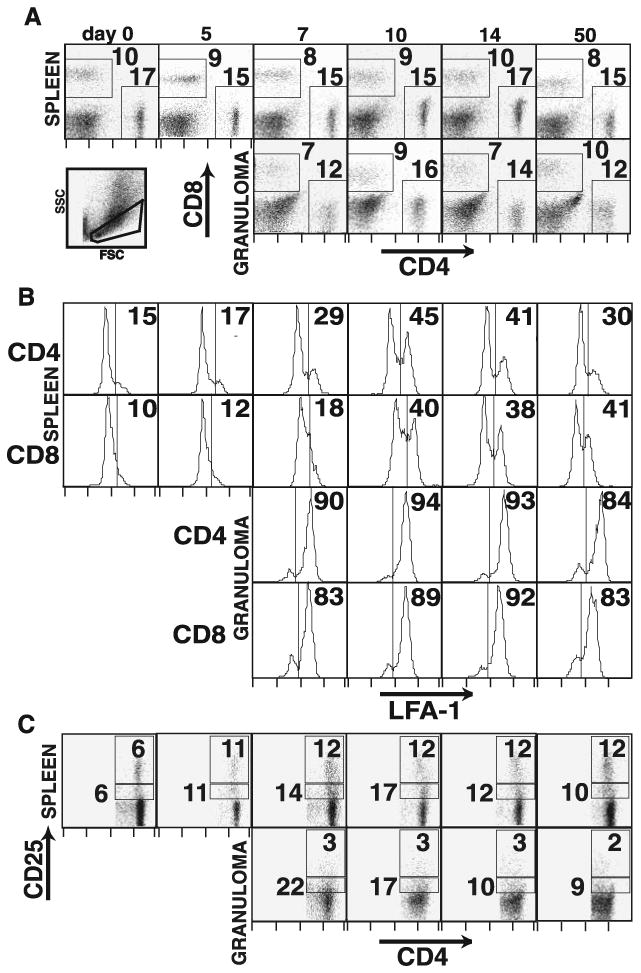
FIGURE 5.

CD4+ and CD8+ T cells in Histoplasma-induced liver granulomas. Flow cytometric analysis of splenocyte and granuloma-infiltrating cells during the course of Histoplasma infection. A, Dot plots represent expression of CD4 and CD8 surface staining on lymphocyte-gated cells from spleen (top row) and granuloma cells (middle row). Lower left dot plot demonstrates forward and orthogonal scatter of the lymphocyte gate for a granuloma suspension. Values on dot plots represent the percentage of the gated cells in the indicated regions. B, Histograms represent expression of LFA-1 on gated CD4+ and CD8+ lymphocyte populations as indicated in total splenocytes (top panels) and granuloma-infiltrating cells (bottom panels). Values represent the percentage of the population having LFA-1 expression higher than the indicated level. C, Dot plots represent expression of CD4 and CD25 surface staining on CD4+ lymphocyte-gated cells from spleen (top row) and granuloma cells (bottom row). Values represent the percentage of the CD4+ gated cells in the indicated (CD25high and CD25int) regions. All plots are representative of three independent experiments.
