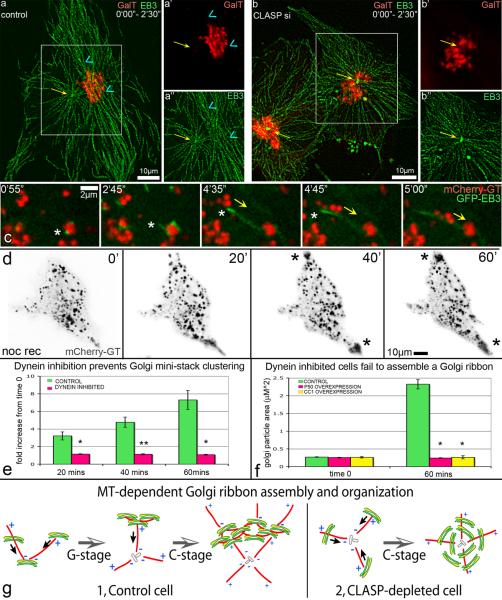
Figure 4. Golgi assembly depends on directionality of two MT subsets and on dynein activity.
(a–b) Overlaid GFP-EB3 (green) and mCherry-GT (red) video frames within 2.5 min. (a) EB3 tracks in a control cell illustrate radial centrosomal (yellow arrow) and tangential Golgi-associated (blue arrowhead) MT arrays. Box is enlarged in (a') for mCherry-GT and in (a”) for GFP-EB3. (b) Radial centrosomal (yellow arrow) EB3 tracks in CLASP-depleted cell (siRNA combination #1). Box is enlarged in (b') for mCherry-GT and in (b”) for GFP-EB3. (c) Video frames illustrating minus-end directed mini-stack movement (yellow arrow) along Golgi-nucleated MTs upon nocodazole washout in mCherry-GT (red) and GFP-EB3 (green) expressing NT control cells. MT plus end, asterisk. Time after nocodazole removal is shown. (d) Video frames illustrating nocodazole washout in cell over-expressing GFP-P50 (not shown) and mCherry-GT (black). Mini-stacks move toward the cell periphery along forming MTs due to kinesin activity (asterisks). Time after nocodazole removal is shown. (e) Fold increase of Golgi particle size upon nocodazole washout based on live cell imaging of control (n=7, 6 independent experiments) and GFP-P50 over-expressing (n=8, 7 independent experiments) cells. Error bars, standard error. *P<0.001, unpaired Student's t-test. (f) Average Golgi particle area (μm2) in nocodazole (time 0) and upon 60 min washout in fixed samples of control, GFP-P50 over-expressing, and RFP-CC1 over-expressing cells. n=50 for each condition, 4 independent experiments. Error bars, standard error. *P<0.001, **P<0.01 unpaired Student's t-test. (g) Role of Golgi-associated MTs in Golgi ribbon assembly (model).

