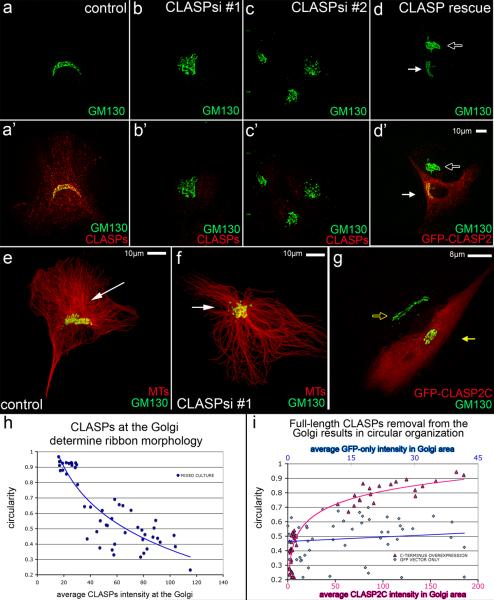
Figure 5. CLASPs at the Golgi determine ribbon morphology.
(a) Control cells have a ribbon-like Golgi (GM130, green) when CLASPs (red, a') are present. (b–c) Golgi (green) morphology is circular when CLASPs (red, b', c') are depleted from cells. (d) Ribbon-like Golgi morphology (white arrow) is restored in CLASP-depleted cells expressing a nonsilenceable GFP-CLASP2C construct (d', false-colored red). The Golgi (GM-130, false-colored green) remains circular in non-expressing cells (hollow arrow). (e–f) Immunostainings of Golgi (GM130, green) and MTs (red). (e) Control cell showing ribbon-like Golgi in the presence of Golgi-associated MTs (white arrow). (f) CLASP-depleted cell (siRNA combination #2) showing circular Golgi morphology and radial centrosomal MT array (white arrow). (g) Ribbon-like Golgi (GM130, false-colored green, hollow yellow arrow) turns circular (yellow arrow) in cells over-expressing GFP-CLASP2C (false-colored red). (h) Golgi circularity depends on CLASPs intensity at the Golgi. Average CLASP intensity at the Golgi in mixed-culture cell plotted against circularity index (n=50, 4 independent experiments). (i) Removal of full-length CLASP results in circular morphology. Average GFP-CLASP2C intensity (pink, lower x-axis) and GFP vector only intensity (blue, top x-axis) in the Golgi area plotted against circularity index (n=50, 3 independent experiments for each condition). Cells with similar overall expression levels are compared, in which GFP-CLASP2c intensity in the Golgi region is 4 to 5 times higher than GFP due to specific accumulation of GFP-CLASP2C in the Golgi area (~1/5 of the cell area). GFP-CLASP2C but not GFP expression leads to circular Golgi morphology.

