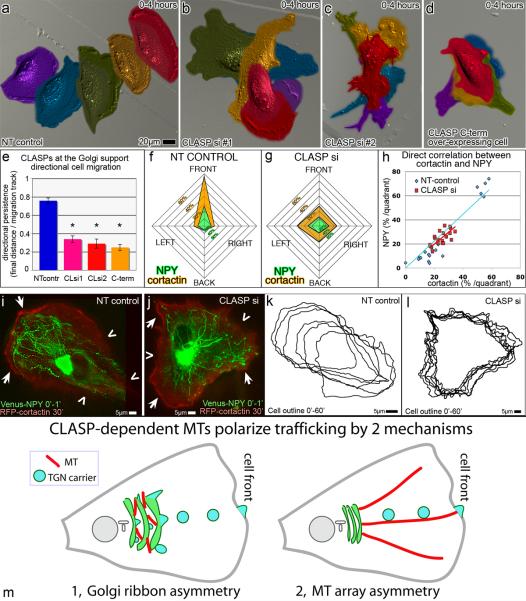
Figure 8. CLASP-dependent MTs regulate directional cell migration.
(a–d) False-colored DIC video frames showing single RPE1 cell migration over a time period of 4 hours. Purple indicates time 0, blue = 1hr, green = 2hrs, yellow =3hrs, and red =4hrs. (a) Control cells exhibit directionally persistent migration. CLASP-depleted cells (b–c) and CLASP2C (d) over-expressing cells show random migration patterns. (e) Average directional persistence for NT-control (n=13, blue), CLASP siRNA combination #1 (n=12, pink) and #2 (n=17, red), and CLASP2C over-expressing (n=15, orange) cells each from 4 independent experiments. Error bars, standard error. *P<0.001, unpaired Student's t-test. (f–g) NPY trafficking (green) directionality and cortactin cell edge distribution (orange) in migrating NT-control (f) and CLASP-depleted (g) cells. Data represent average percentage per quadrant (Fig. S6) of track number within 1 min and cortactin-associated cell edge length over 30 min thereafter. n=5 from 4 independent experiments for each condition. (h) Direct correlation between NPY track number and cortactin-rich cell edge in NT-control (blue) and CLASP-depleted (red) cells. Each point represents correlation within one quadrant of an individual cell. (i–j) NPY tracks within 1 minute (green) overlaid with RFP-cortactin (red (see “Image processing”)) at 30 minutes after track recording in NT-control (i) and CLASP-depleted (j) cells. Arrows, cortactin enrichment. Chevrons, regions lacking cortactin. (k–l) Cell outlines showing cell relocation and edge dynamics over 1 hour with 10 minute interval. (k) NT-control, same as (i). (l) CLASP-depleted cell, same as (j). (m) Proposed mechanisms by which CLASP-dependent MTs polarize trafficking (model).

