
Figure 4.
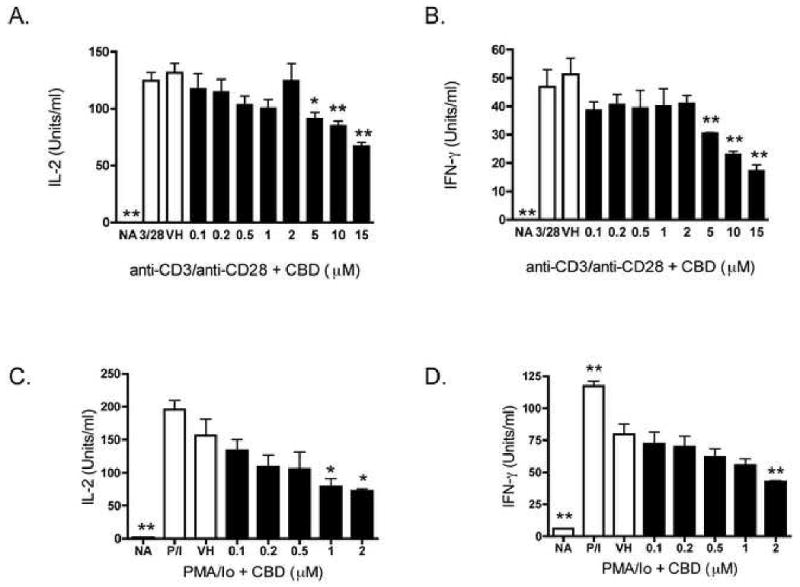
CBD suppressed cytokine production in B6C3F1 splenic T cells. A-B.) Splenocytes (8 × 10⁵ cells) were treated with CBD (0.1-15 μM) for 30 min, followed by cellular activation with immobilized anti-CD3 plus soluble anti-CD28 for 24 hr. Supernatants were harvested and the amount of IL-2 (A.) or IFN-γ (B.) was determined by ELISA. C-D.) T cells purified from splenocytes (8 ×10⁵ cells) were treated with CBD (0.1-2 μM) for 30 min, followed by cellular activation with PMA/Io for 24 hr. Supernatants were harvested and the amount of IL-2 (C.) or IFN-γ (D.) was determined by ELISA. The data are expressed as the mean Units/ml ± SE of triplicate cultures. * or ** denotes values that are significantly different from the vehicle control at p < 0.05 or 0.01. Results are representative of at least two separate experiments. NA, naïve (untreated); VH, vehicle (0.1% ethanol).