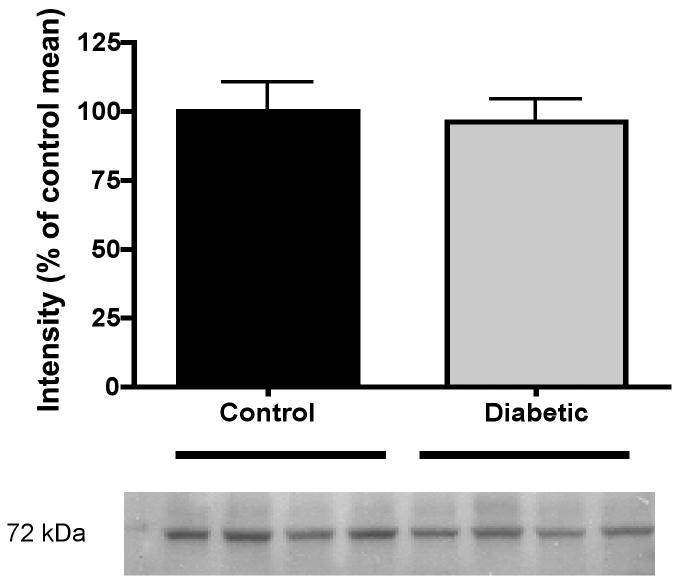
Figure 1.
Representative blot for prosaposin and densitometric quantification of prosaposin protein (72 kDa) in sciatic nerve of control and 12-week STZ-diabetic rats. Individual lanes were first normalized to their relative actin content and then values for each diabetic lane were normalized to the mean intensity of control lanes on the same blot to allow for inter-blot comparisons. Data are mean ± SEM (n = 10 to 14 per group).

