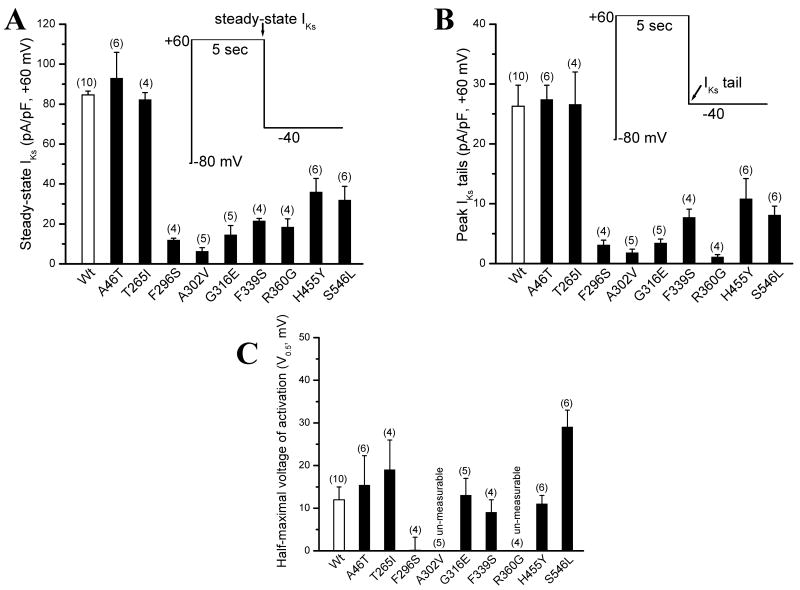
Figure 3.
Summarized data for WT and mutated IKs currents. A. Steady-state IKs current levels for WT and mutations. The currents were measured at the end of a 5-sec depolarizing pulse. B. The peak IKs tail current for WT and mutations. The peak tails were measured after a 5-sec repolarising pulse to -40 mV. C. The half-maximal voltage of IKs activation (V0.5, mV) for WT and mutations. After the current-voltage relations were obtained, the V0.5 values were obtained after fitting individual data points to the Boltzmann equation: I=Imax/{1+exp[(Vt-V0.5)/k]}. Two mutations (A302V and R360G) expressed too tiny tail currents to generate a V0.5 value.

