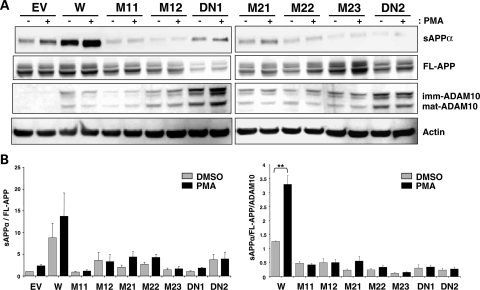
Figure 4.
Attenuated PMA-inducible α-secretase activity in CHO cells stably expressing the prodomain mutant forms of ADAM10. Each CHO-APP-ADAM10 stable cell line was treated with 1 µM PMA or equivalent amount of DMSO for 6 h and harvested to monitor sAPPα levels. (A) Representative western blots. (B) Graphs for relative sAPPα levels. n = 4–6, mean ± SEM. **P < 0.005 (two-tailed Student's t-test).

