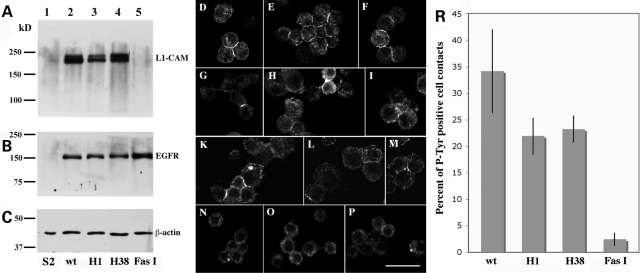
Figure 3.
Quantitative evaluation of the ability of wild-type and mutant human L1-CAM proteins to induce human EGFR tyrosine kinase activity at S2 cell–cell contact sites. (A–C) Represent western blots of total protein extracts (50 µg per lane) from induced untransfected (lanes 1) or transfected (lanes 2–5) S2 cells. Blot A was incubated with anti-L1-CAM, blot B with anti-EGFR and blot C with anti-β-actin antibodies, respectively, and developed with enhanced chemiluminescence (ECL) reagent after an incubation with HRP-labeled secondary antibodies. (D–P) Show confocal microscopy images of small S2 cell aggregates that were incubated with an anti-phosphotyrosine antibody probe. S2 cells in (D–F) co-express wild-type human L1-CAM and EGFR, (G–I) mutant H1 L1-CAM and wild-type human EGFR, (K–M) mutant H38 L1-CAM and wild-type EGFR and (N–P) Drosophila Fasciclin I protein with wild-type human EGFR. The scale bar represents 20 µm. (R) depicts a quantitative analysis of cell contacts staining for phosphotyrosine for the four different cell lines depicted in the previous panels. These results were obtained from four separate experiments using two independently transfected S2 cell lines for each construct. At least 100 cell–cell contacts were evaluated per experiment for each transfected cell line. In comparison to wild-type L1-CAM transfected cells P= values were calculated for H1 transfected cells as P = 2.8 × 10⁻², for H38 transfected cells as P = 3.6 × 10⁻² and for Fasciclin I transfected cells as P = 0.3 × 10⁻².

