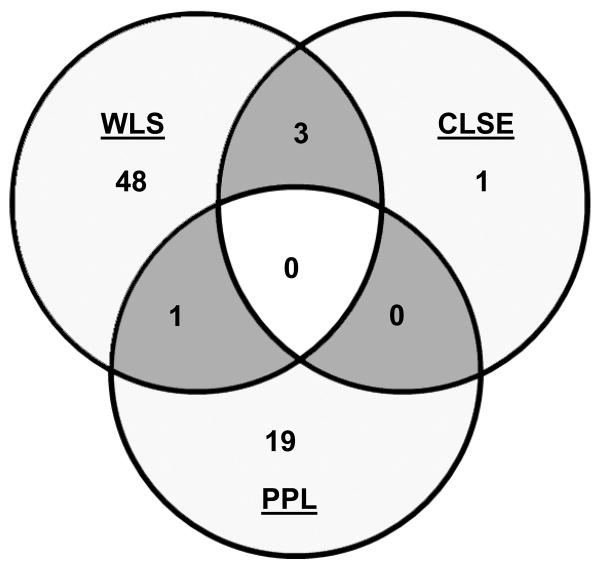
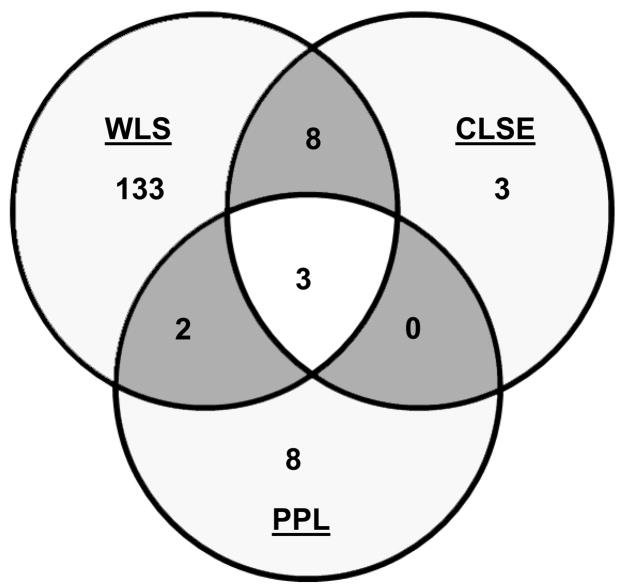
Fig. 3. Comparison of genes induced by WLS, CLSE, and PPL treatment.
Venn diagram showing overlap of genes induced by WLS, CLSE, and PPL after 30 min (A) and 2 h (B) treatment. Genes induced >1.5-fold (P<0.05) in at least one condition and whose array signals passed quality filters in all three conditions were included.


