
Figure 6.
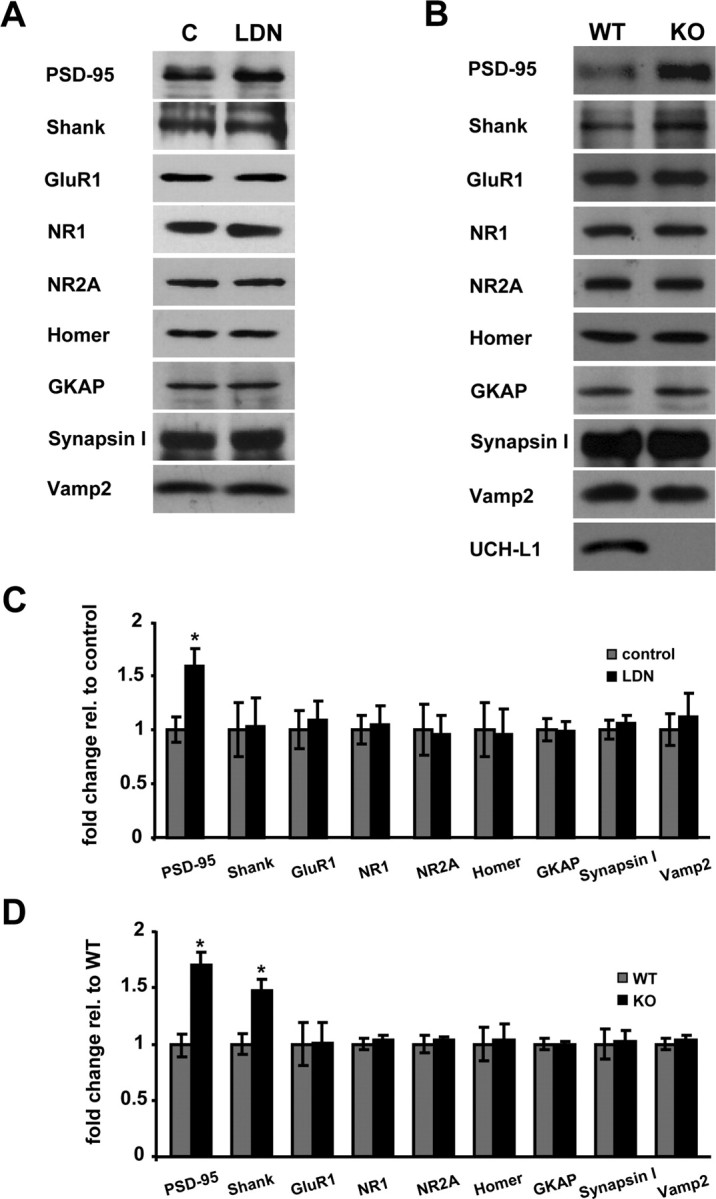
Comparison of synaptic protein expression levels in control and LDN-treated neurons and in wild-type and UCH-L1-deficient mouse brains. A, B, Lysates from control and LDN-treated cultured neurons (A) or homogenates from wild-type and UCH-L1-deficient mouse brains (B) were subjected to Western blot analysis. C, D, Relative band intensities were quantified and normalized to those of control neurons or wild-type mouse brains. The quantified data were obtained from two and four independent experiments for brain homogenates and LDN-treated neurons, respectively. Mean values ± SEM are shown. *p < 0.01, unpaired Student's t test.