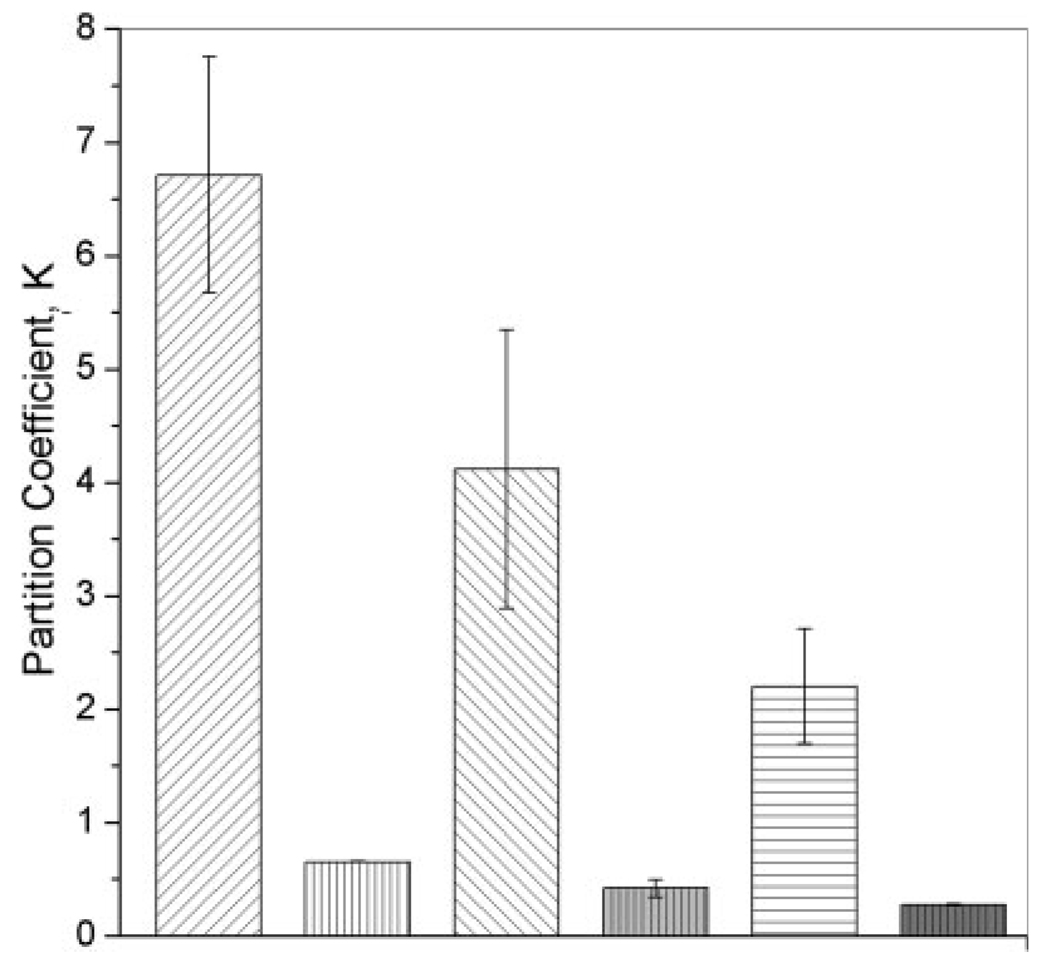
Figure 1.
Plot of the partition coefficients for anionic and cationic hydrogels: ( ) MAA–PEGDMA200 (n = 6), (
 ) DMAEM–PEGDMA200 (n = 3), (
 ) MAA–PEGDMA600 (n = 6), (
 ) DMAEM–PEGDMA600 (n = 3), (
 ) MAA–PEGDMA1000 (n = 6), and (
 ) DMAEM–PEGDMA1000 (n = 3). The incorporation was performed in DI water at 5.0°C. Each bar represents an average plus or minus 1 standard deviation.

