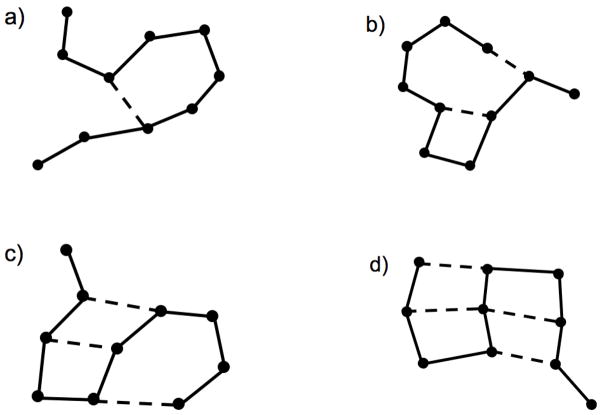
Figure 1.
Typical constraint networks are shown. Atoms are represented as vertices. Edges represent central force chemical bond interactions between atomic pairs. Solid lines represent covalent bonding, and dashed lines represent hydrogen bonding. The four panels show some examples of how the constraint network can fluctuate as hydrogen bonds break and form. Each panel represents a fixed constraint topology, and the constraint network is labeled with the ν index, as explained in the text.

