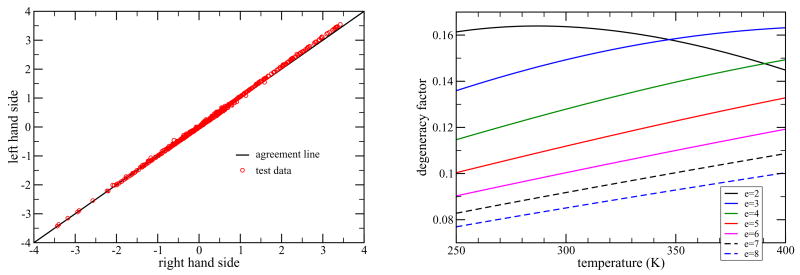
Figure 3.
(a) Left Panel: The corresponding left and right hand sides of Eq. (3) in arbitrary units are plotted on the y and x-axis respectively to form the scatter plot shown as red circles. The black straight line shows the agreement line. These are typical results for 3000 random polynomials at room temperature, T = 300K, and a binding energy of |u(l)| = 6 kcal/mol. (b) Right Panel: The degeneracy factor, ω, given in Eq. (5) to parameterize the weighting prefactor C, is plotted as a function of temperature. A series of curves are shown corresponding to the case of using a 12-6 Lennard-Jones potential with binding energies ranging from 2 kcal/mol to 8 kcal/mol. Note that by time the binding energy is 2 kcal/mol, the temperature dependence of ω becomes distinctly different from all the rest of the cases.

