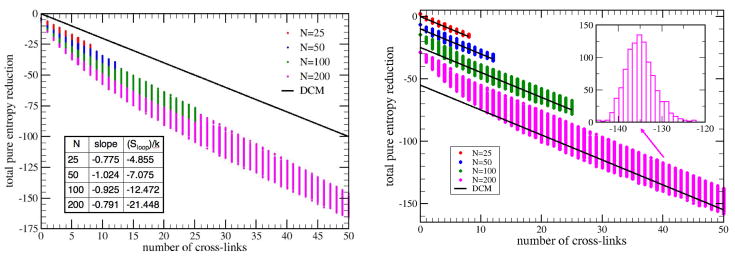
Figure 7.
(a) Left panel: Scatter plot showing the pure entropy reduction that occurs when adding 0 to ≈ N/4 cross-links to a single outer loop of N edges, with N = 25, 50, 100 and 200. The DCM prediction is shown as a solid black line, but entropy reduction depends on the details of where the cross-links are placed. The scatter plot provides “error bars” showing a smaller variance for less number of cross-links. (b) Right panel: The systematic errors that are linearly dependent on the number of cross-links have been absorbed into the DCM local entropy parameter. The y-intercepts were arbitrarily shifted for different N to prevent crowding. Note that for N = 200 the black solid line does not pass through the center of the “error bars”, because the density profile of sample points is not uniform. The inlet shows the histogram for 1000 random samples with 40 cross-linkers.

