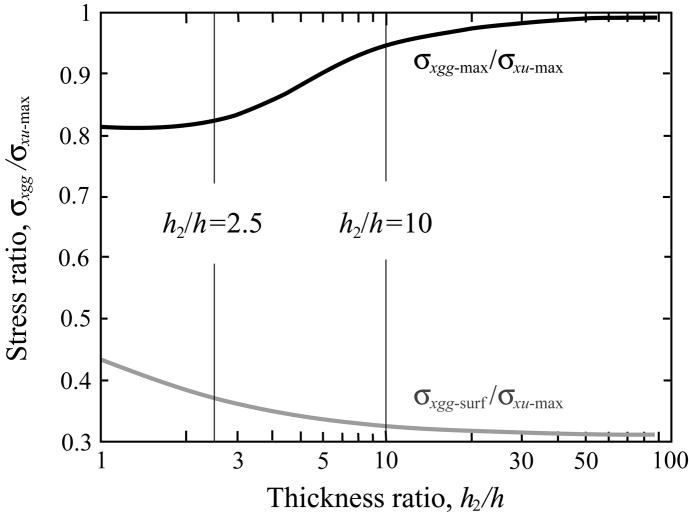
Fig. 6.
Plots of maximum stress ratio (σxgg-max/σxu-max, black curve) and surface stress ratio (σxgg-surf/σxu-max, gray curve) of graded and homogeneous beams as a function of the beam to graded layers thickness ratio. The maximum stress ratio was derived from Eqs. (11) and (14), while the surface stress ratio was computed using Eq. (15). Vertical lines indicate thickness ratios of h2/h = 2.5 and 10.

