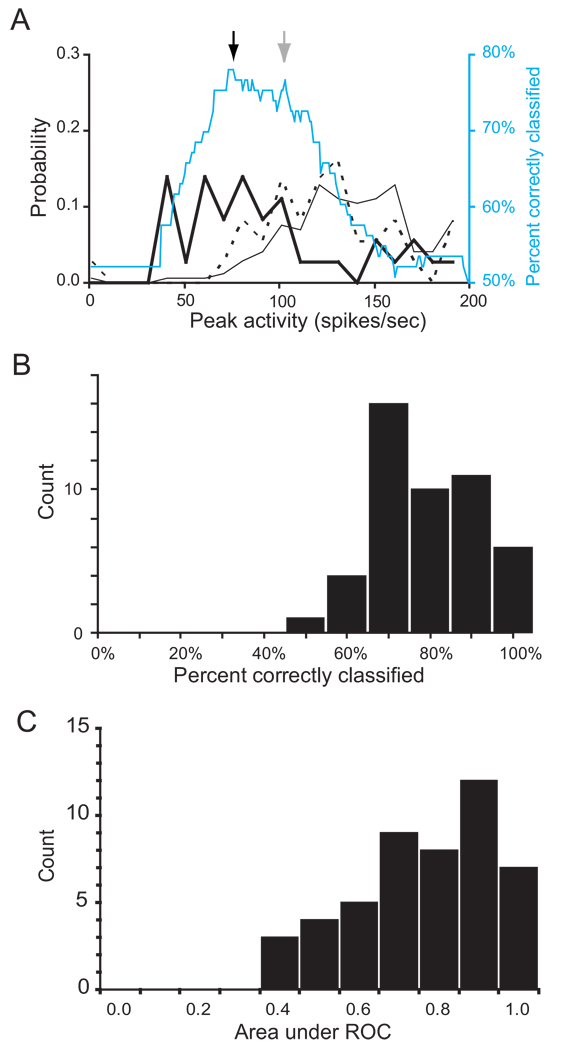
Figure 7.
Computing optimal discriminant threshold for neuron shown in Figure 5. A. Probability density distributions of peak discharge rate in trials with no stop signal (thin black), in noncanceled stop signal trials (dashed black) and in canceled stop signal trials (thick black). Percent of trials correctly classified as canceled or noncanceled is plotted as a function of criterion discharge rate (cyan). Threshold was defined as the criterion discharge rate that maximized the number of canceled trials with activity below the criterion and the number of non-canceled trials with maximum activity above the criterion. For this neuron, a threshold of 76 sp/sec provided the maximal discrimination accuracy of 78% (marked by black arrow). The discriminant accuracy function had a plateau around the maximum, so the true threshold value could lie anywhere within this range. A threshold of 103 sp/sec, which agrees more closely with the neurometric threshold, yielded a predictive accuracy of 77% (marked by gray arrow). B. Distribution of values of percent correctly classified by a particular threshold for the 48 movement-related neurons. The median value was 75% correctly classified trials. C. Histogram of areas under the ROC curve for the 48 FEF movement-related cells, using cancelled vs. non-cancelled trials.

