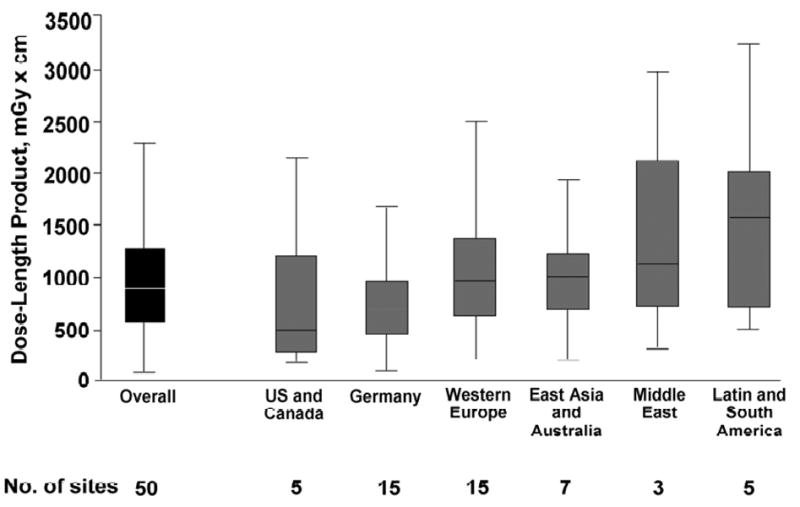
Figure 3.

Box-and-whiskers plot of dose length product overall and by geographic location of study sites. Middle horizontal line, median; upper and lower edges of boxes, 25th and 75th percentiles of the interquartile range (IQR), respectively; lower whiskers, 25th percentile minus 1.5 times IQR; upper whiskers, 75th percentile plus 1.5 times IQR. From Hausleiter J, Meyer T, Hermann F, et al. Estimated radiation dose associated with cardiac CT angiography. JAMA 2009;301:500
