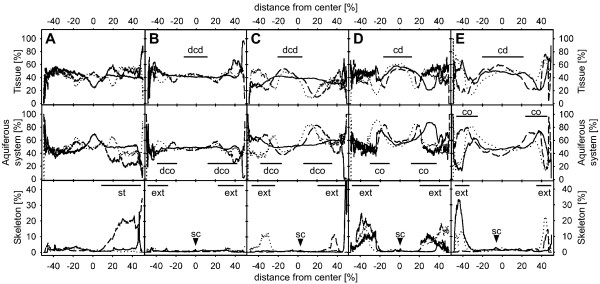
Figure 3.
Volume analysis of body structures in T. wilhelma buds based on SR-μCT. (A) stage 1 bud without choanoderm/cortex differentiation; (B) stage 2 bud without a separated choanoderm but displaying the first differentiated aquiferous system canals; (C) stage 3 bud with an early developing choanoderm (dcd) and developing cortex (dco), (D - E) stage 4 buds with differentiated choanoderm (cd) and cortex (co) regions. Graphs represent relative volumetric proportions of all main morphological sponge structures: tissue (top row), aquiferous system (middle row) and skeleton (bottom row). Graph patterns typical for distinctly developed sponge regions are marked (sc - skeleton centre, ext - body extension (filaments), st - stalk). Volumetric results are given for the three main axes of the 3D data sets: x-axis (dashed), y-axis (dotted) and z-axis (solid).

