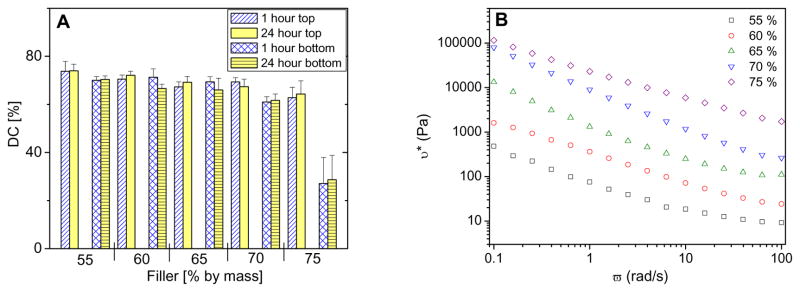
Figure 3.
Degree of conversion and material processability. A: Degree of conversion of composites measured using FTIR-RM. Results are an average of five measurements, and error bars represent one standard deviation and are the estimate of standard uncertainty. B: Viscosity of composite pastes as a function of filler content.

