Figure 3.

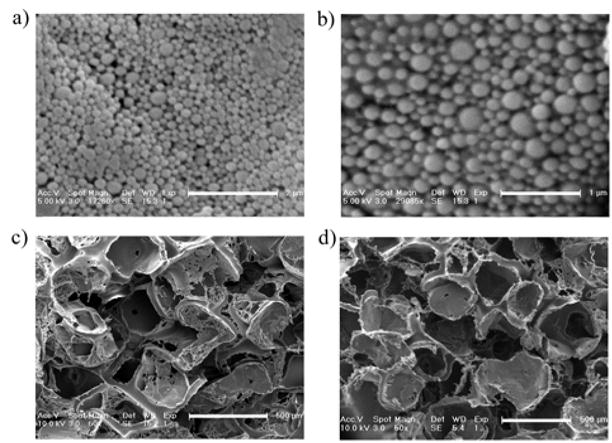
SEM micrographs of nanospheres a) PLGA-PLL 502H, b) PLGA 502H; and salt-leached sponges c) PLGA-PLL 503H, d) PLGA 503H. Scale bars a: 2 μm b: 1 μm, c/d: 500 μm.

SEM micrographs of nanospheres a) PLGA-PLL 502H, b) PLGA 502H; and salt-leached sponges c) PLGA-PLL 503H, d) PLGA 503H. Scale bars a: 2 μm b: 1 μm, c/d: 500 μm.