Figure 5.

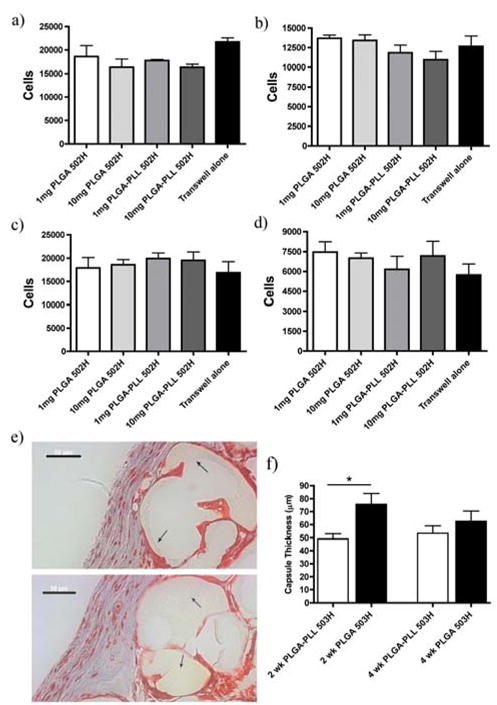
Cyto/Biocompatibility. Evaluation of PLGA or PLGA-PLL 502H nanosphere cell viability via MTT assay on Rat ECs a) 1 day, b) 3 day exposure and HUVECs c) 1, day d) 3 day exposure. e) Masson’s trichrome staining of sponges excised at 2 weeks post implantation. Top/Bottom: PLGA 503H/PLGA-PLL 503H. Arrows demarcate sponge and its location relative to the collagen capsule (blue). Scale bars: 50 μm. f) Quantification of collagen capsule thickness from subcutaneously implanted PLGA503H/PLGA-PLL 503H salt-leached sponges (n=15). All data represent mean ± SEM (n=3 unless stated otherwise). * p < 0.05.
