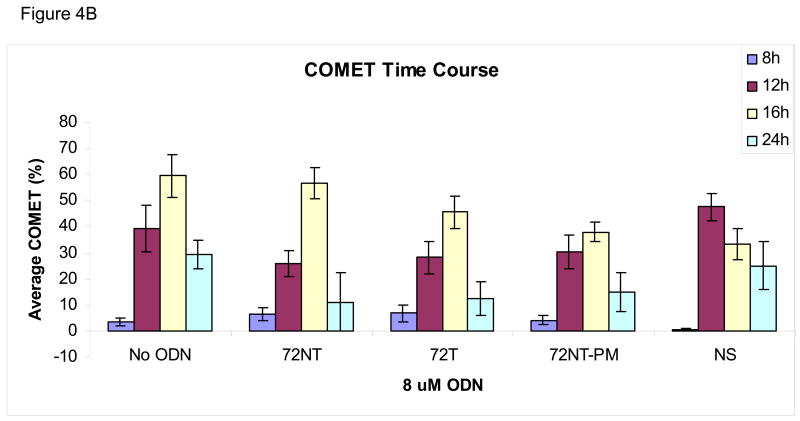
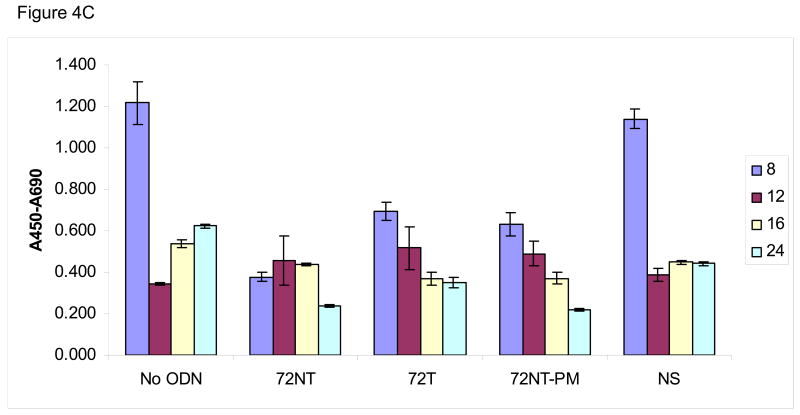
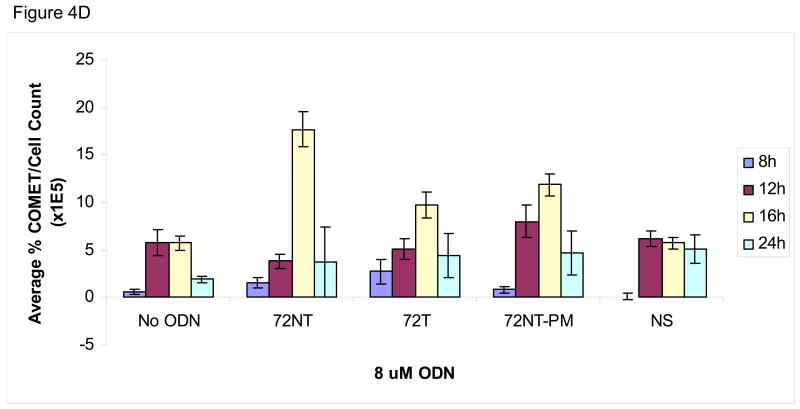
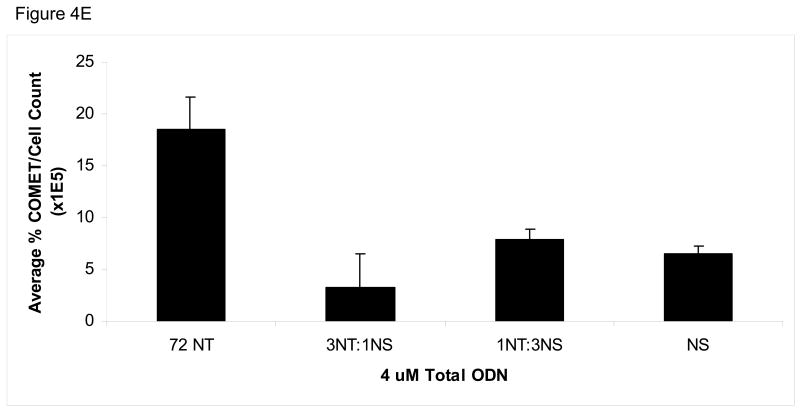
Fig. 4.
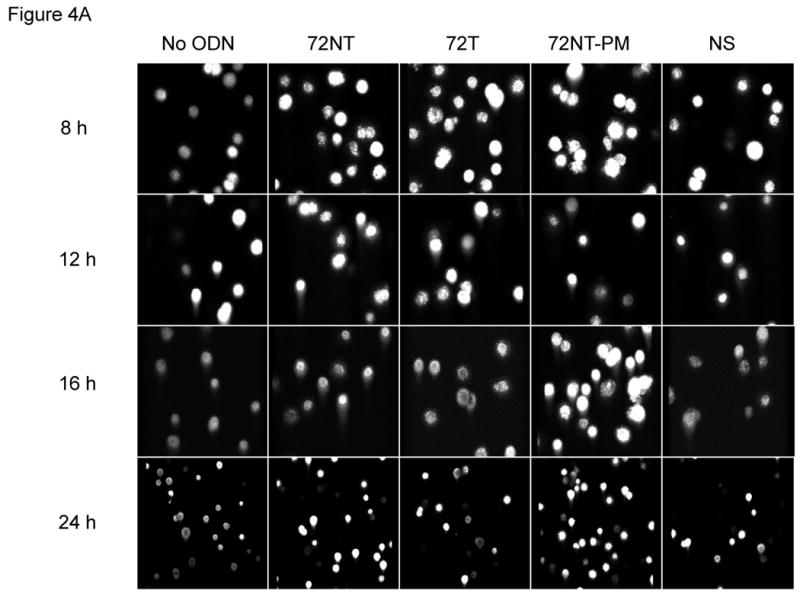
(A) COMET assay shows single-stranded DNA breaks with and without the presence of 8 μM ODN. CPT (300 nM for 24 h) is used as a positive control. (B) Quantification of COMET time course. Average percent COMETs per field was used to compare between treatments over time. Error bars are standard error. (C) BrdU incorporation in ODN-treated and untreated cells over time demonstrates that ODN inhibits the level of cellular replication. Cells without ODN present are able to replicate at a higher level. Error bars are standard error. (D) Normalizing the average percent COMET data (B) to the cell counts for each treatment over time highlights the significant level of single-strand breaks present in cells treated with targeting ODN at 16 hours post-electroporation that are independent of replication. (E) Mixing experiment shows that addition of NS ODN significantly reduces the amount of single-strand breaks associated with targeting ODN presence in cells. 72NT and NS ODNs were mixed in molar ratios totaling 4 μM ODN. As in (D), average percent COMETs are normalized to cell count.

