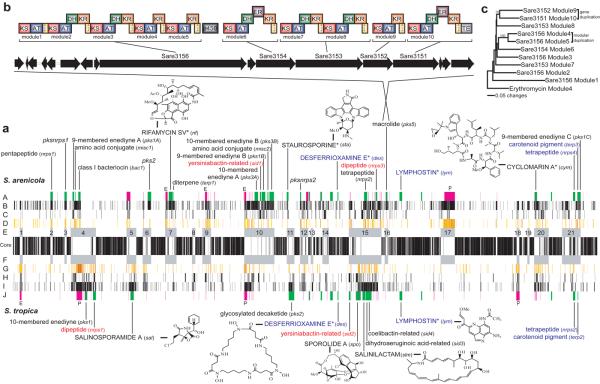
Figure 1.
Linear alignment of the S. tropica and S. arenicola genomes starting with the origins of replication. (a) Positional orthologs (core) flanked by islands (E, F), heat-mapped HGT genes (D, G), rearranged orthologs (C, H), species-specific genes (B, I), secondary metabolite genes (green), MGEs (pink) with prophage (P) and AICES (E) indicated (A, J). For genomic islands, predicted (lower case) and isolated (uppercase with structures) secondary metabolites are given (not shown are six non-island secondary metabolic gene clusters of unknown function). Shared positional (blue) and rearranged (red) secondary metabolite clusters are indicated. *Previously isolated from other bacteria. (b) Expanded view of SA pks5 revealing gene and modular architecture. (c) Neighbor-joining phylogenetic tree of KS domains from SA pks5 revealing gene and modular duplication events (erythromycin root, % bootstrap values from 1000 re-samplings).

