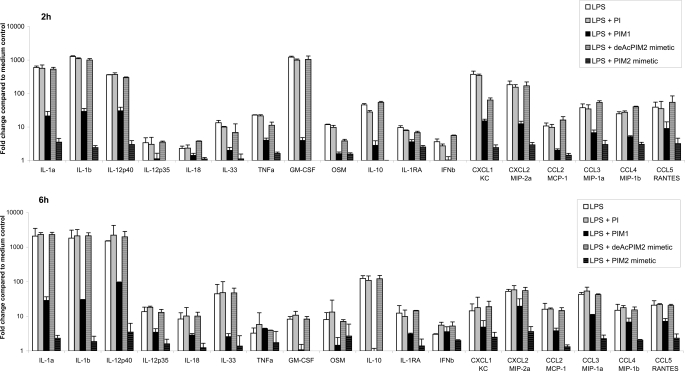
FIGURE 7.
Inhibition of chemokine and cytokine gene expression by PIM analogues in LPS-stimulated macrophages. Real-time reverse transcription-PCR quantification of the expression of the indicated cytokine and chemokine genes 2 h (top) and 6 h (bottom) after LPS stimulation (0.1 μg/ml) of bone marrow-derived macrophages in the presence of synthetic PI, PIM1, PIM2 mimetic, and de-acylated Ac2PIM2 mimetic (all at 10 μg/ml) or DMSO vehicle alone. The data for the different genes are normalized versus the expression of Hprt1, glyceraldehyde-3-phosphate dehydrogenase, 18 S, β2-microglobulin housekeeping genes and presented as ratio of stimulated cells over unstimulated controls. Results are expressed as the mean ± S.D. of n = 2 mice and are from one experiment representative of two independent experiments. GM-CSF, granulocyte-macrophage colony-stimulating factor; IFNb, interferon β. OSM, oncostatin M.

