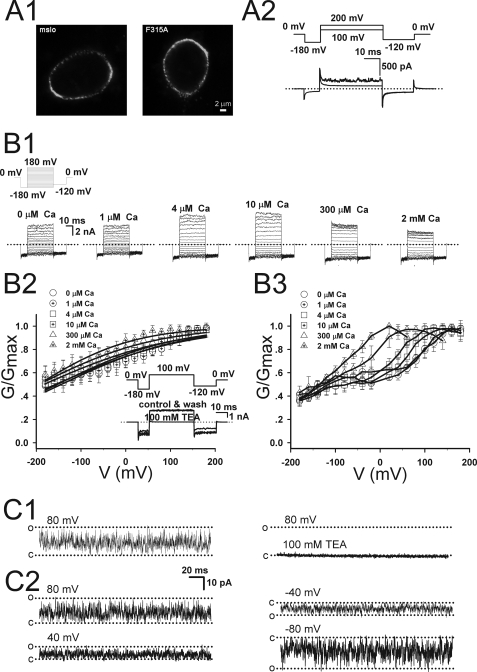
FIGURE 5.
The surface expression and the current properties of Phe-315 mutations. A1, the immunofluorescence images of HEK293 cells transfected with WT mSlo1 or F315A are compared. Channels were tagged with c-Myc epitope and labeled with anti-c-Myc antibody. A2, the current traces of F315A channels were obtained from an inside-out patch in the presence of 10 μm Ca2+. The voltage protocol is placed at the top. B1, representative current traces were obtained from inside-out patches for F315Q at different [Ca2+]i. Voltage steps placed at the top were executed from −180 to 180 mV by 20-mV increments after 20 ms at −180 mV and then returned to −120 mV. The G-V curves were generated over [Ca2+]i from 0 to 2 mm for F315Q by tail currents (B2) and steady-state currents (B3). The intracellular [Ca2+]i are: circle, 0; circle with cross-hair,1 μm; square, 4 μm; square with cross-hair,10 μm; triangle, 300 μm; triangle with cross-hair, 2 mm. The inset shows representative current traces from inside-out patches in 10 μm [Ca2+]i, which were elicited in before (control), during, and after (wash) application of 100 mm TEA. The voltage protocol is placed at the top of the inset. The dotted lines represent zero current. C1, single-channel currents of F315Q were obtained at 80 mV in the presence of 10 μm Ca2+ with/without 100 mm TEA as indicated. C2, the single-channel currents of F315Q were obtained at 80, 40, −40, and −80 mV in the presence of 10 μm Ca2+.

