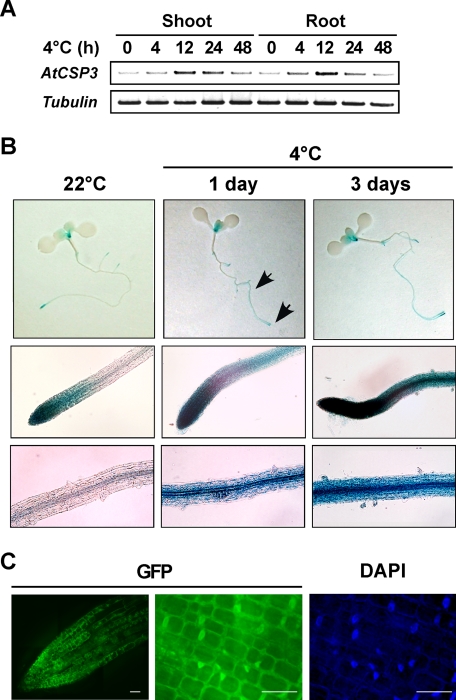
FIGURE 2.
Expression in response to cold and subcellular localization of AtCSP3. A, semi-quantitative RT-PCR with RNA from shoot and root tissues of 10-day-old seedlings. B, histochemical localization of GUS activity in AtCSP3 promoter-GUS transgenic seedlings. 10-day-old seedlings grown on agar plates were treated with cold stress (4 °C for 1 or 3 days). The top row (panels) shows whole seedlings. Middle and bottom rows show root tip including distal elongation zone and the central portion of the root, respectively (indicated by arrows). Scale bars are: top, 1 μm; middle, 50 μm; bottom, 20 μm. C, fluorescence microscopic images of the cells expressing the AtCSP3-GFP fusion gene. Deconvolution images of primary root tip from 10-day-old transgenic seedling were visualized for GFP (left and middle panel). DAPI staining (right panel) was performed for nuclear localization. Scale bars are 10 μm.

