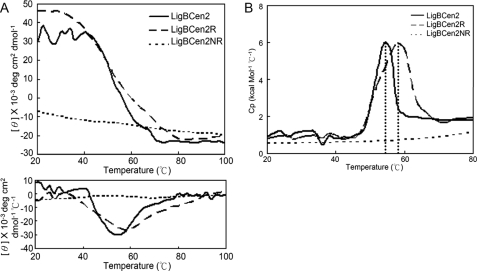
FIGURE 5.
Thermal unfolding transitions of LigBCen2, LigBCen2R, or LigBCen2NR as measured by CD and DSC. A, thermal unfolding of 10 μm LigBCen2, LigBCen2R, or LigBCen2NR was observed by CD, measuring ellipticity at 205 nm from 20 to 100 °C. A transition point was identified for LigBCen2 and LigBCen2R but not for LigBCen2NR. The melting temperatures were determined by the location of the peak in the derivative of the ellipticity curve, as shown in the lower panel. The transition midpoints of LigBCen2 and LigBCen2R are 54.0 ± 0.5 and 58.1 ± 0.8 °C, respectively. B, thermal unfolding transitions of LigBCen2, LigBCen2R, and LigBCen2NR measured by DSC. Molar heat capacity (kcal/(mol·K)) was plotted against temperature (°C) from 20 to 80 °C for 3 μm LigBCen2, LigBCen2R, or LigBCen2NR. The dotted line indicates that the midpoint temperatures of the transitions for LigBCen2 and LigBCen2R are 54.2 ± 0.4 and 57.3 ± 0.2 °C, respectively.

