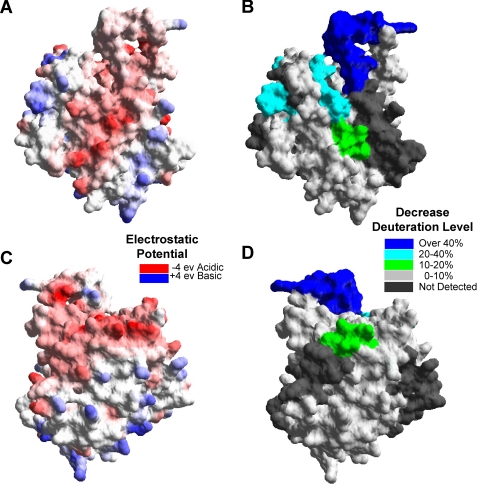
FIGURE 6.
The electrostatic potential of the GVIA-2 iPLA2 and the affected regions in the deuteration level upon PAPC vesicle binding. A, the electrostatic potential mapped to the molecular surface was calculated by Swiss-PdbViewer 3.7 based on simple coulombic interactions. B, the regions with decreases of amide hydrogen/deuterium exchange are shown on the molecular surface of the catalytic domain. C and D, the corresponding back views of A and B, respectively.

