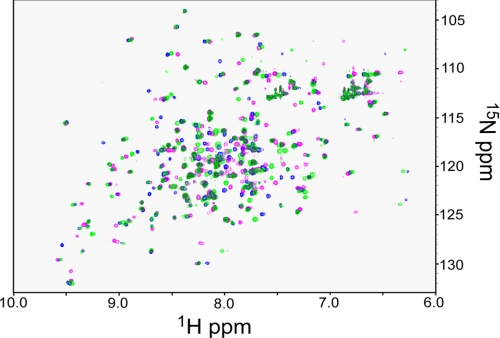
FIGURE 5.
Structural effects of metal binding to BdbD monitored by NMR. 1H 15N-HSQC spectra of reduced sBdbD (200 μm) in 50 mm potassium phosphate, pH 7.0. The spectrum in green corresponds to the as-isolated Ca2+-bound form, and the spectrum in magenta resulted from Ca2+-depleted sBdbD. The spectrum in blue was obtained following the addition of an excess of Mg2+ ions to metal-depleted sBdbD.

